If you've run Meta ads for any length of time, you've heard the number: 50 conversions per ad set per week. Meta has repeated it for years, and on October 21, 2026 they put it in writing again in a peak season guide, this time with a cost attached:
"Give each ad set enough volume to learn from. Roughly fifty conversions a week. Below that the system is guessing. In our analysis, ad sets under that threshold ran about 28% more expensive per purchase."
- Meta for Business, "Peak Season 2026: You Don't Beat The Auction. You Brief It." October 21, 2026
Most advertisers treat the 50 as something Meta made up. A round number, easy to remember, probably picked by a product manager, and OK to be ignored.
It isn't. There's a mathematical reason behind it, and once you see it you'll understand not just why 50 matters but why splitting your budget across ad sets can cost you money.
Imagine you run a store
Imagine you are the manager of a brick and mortar store. Your store gets about 350 visitors a day, and 2%, about 1 in 50, end up making a purchase. That works out to 7 sales a day on average.
You decide to make a plot of the number of sales per day for the last four weeks. Here's what it looks like.
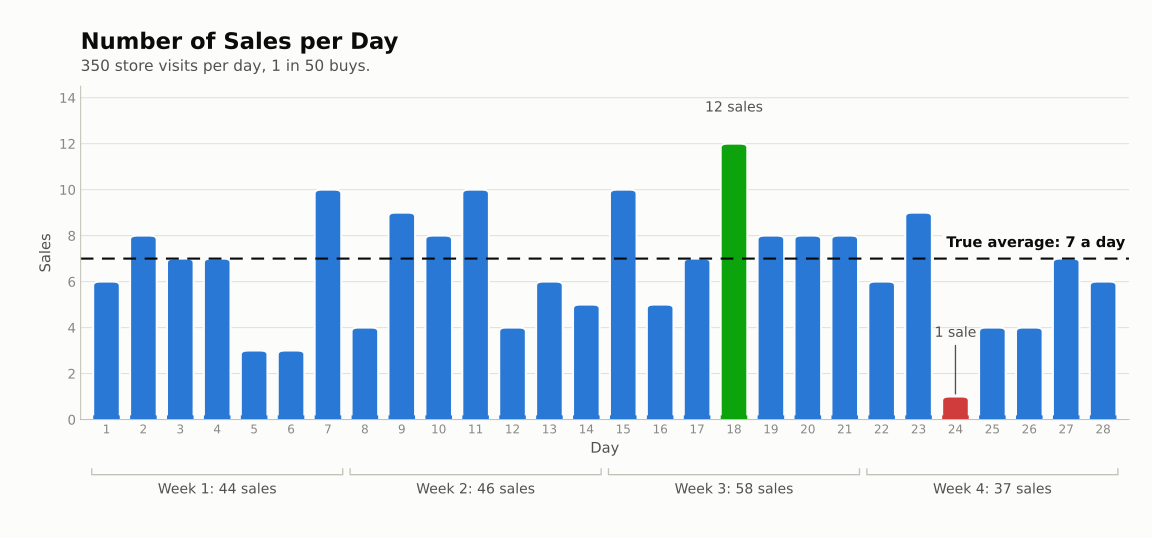
Look at that for a second. Day 24 had one sale. Day 18 had twelve. Week 3 was your best week at 58. Week 4 was your worst at 37. If you were the manager looking at this, you'd have questions. What went wrong in week 4? What did we do right on day 18? Was it the weather? The new display?
But the odds of a sale never changed. I made this chart on a computer by simulating 350 shoppers a day, each with a 1 in 50 chance of buying, for 28 days. Every bar is pure chance. The store was identical every single day.
This chart reveals something uncomfortable: at 7 sales a day, a one-sale day and a twelve-sale day are both ordinary luck. There is nothing in this chart to learn from. A manager who tries will learn things that aren't true.
How much does a count bounce around on its own?
Statisticians have a word for this, standard deviation, which sounds intimidating but means something simple: on a typical day, how far from the average does the count land? For this store, a typical day is about 2.6 sales off from the average of 7. That means about two days in three fall somewhere between 4 and 10. And one day in three lands outside that range for no reason at all. The problem with analyzing low conversion numbers is that a lot of variation is natural. Low and high sales days look meaningful, but in reality they likely are not.
Let's call that typical difference from the expected number of sales the "wobble," expressed as a percentage of the average. For this store, 2.6 out of 7 is about 38%. That's a lot. A 38% wobble means a genuinely good day and a genuinely bad day are hiding inside the normal noise, and you can't tell them apart from a lucky or unlucky one.
So what would it take to shrink the wobble?
Same store, ten times the traffic
Suppose your store got 3,500 visitors a day instead of 350. Same 1 in 50 odds. Now you average 70 sales a day. Here's the same four-week plot.
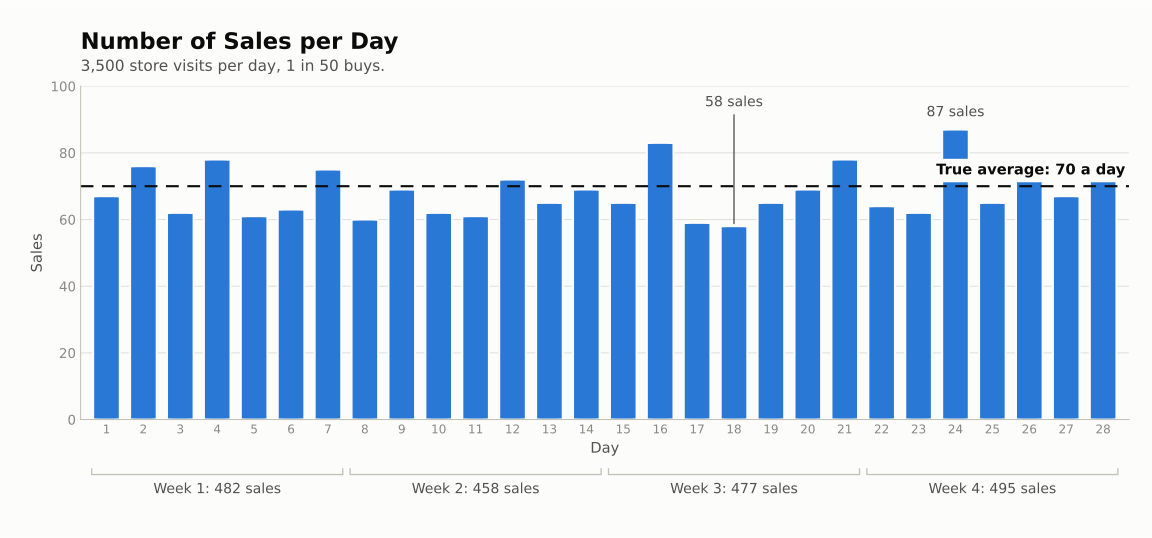
The worst day was 58. The best was 87. The weekly totals barely moved. Put the two stores side by side and the difference is plain.
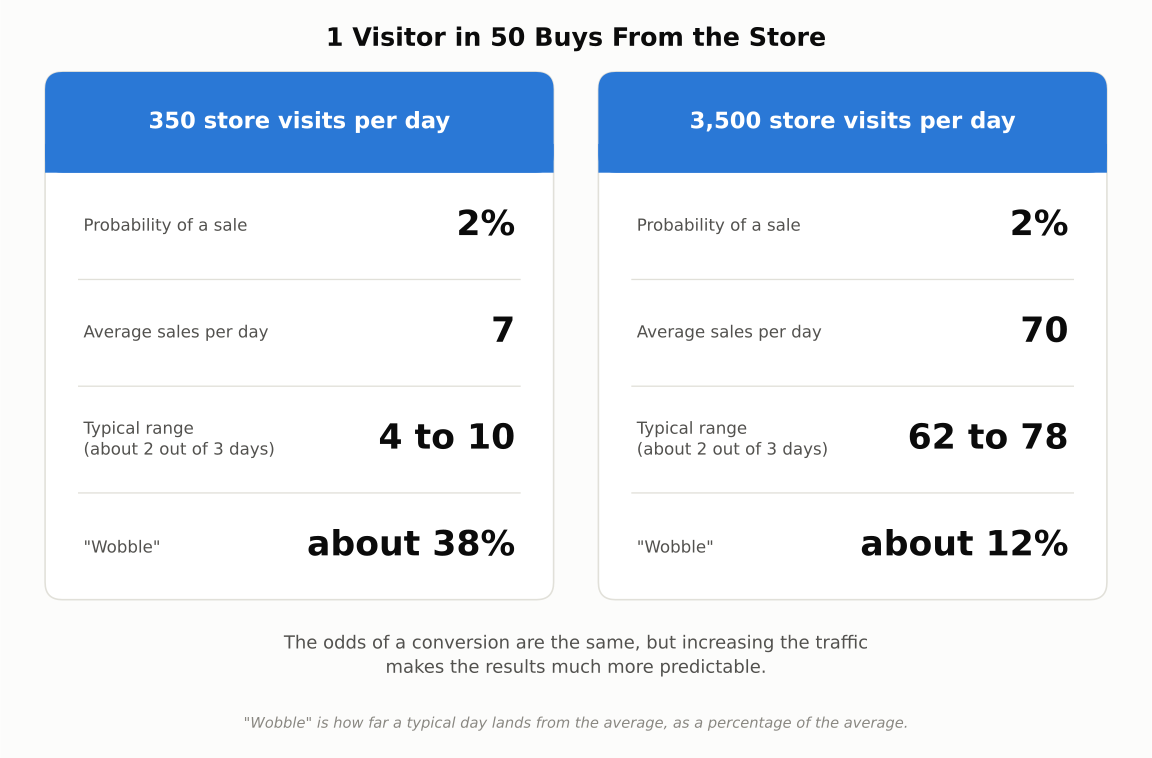
The odds of a sale didn't change. The level of traffic did. And the wobble dropped from 38% to 12%.
There's a catch, though: the wobble shrinks slowly. To cut it in half, you need four times as many sales. Ten times the traffic got you about a third of the wobble, not a tenth.
Now hand the receipts to someone else
Here's where this connects to Meta.
Suppose you hire an assistant whose only job is to decide which product goes on the front shelf. They see the daily sales count and nothing else.
A bad assistant would react to every number. Three sales on Tuesday, two of them product A, so A goes up front. Ten sales on Thursday, six of them product B, so B goes up front. Back and forth every night, reacting to noise and calling it optimization.
A good assistant knows better. They know that 3 on Tuesday and 10 on Thursday are both inside the normal wobble, and that moving products around based on them would be guessing. So they wait. They need enough receipts to tell a real difference from a lucky streak, and until they have them, the shelf is arranged on a best guess rather than on "evidence."
Meta is the good assistant. Inside your ad set there are several ads, and Meta decides which one gets shown most. Meta's system knows how much data it needs before its decisions mean anything, and it tells you. That's the learning phase. An ad set stays in learning until it has seen roughly 50 conversions in a week, and if it never gets there, Meta flags it as "learning limited" and says plainly that it can't optimize delivery.
That's not a bug. That's the assistant telling you there aren't enough receipts to work with. And it has to show something every day regardless, so your budget runs on its best guess, week after week. Meta's own guide says it in four words: "the system is guessing."
Why 50 is the number
Go back to the first store. It averaged 7 sales a day, which is about 50 a week. Look at the daily bars and you see chaos. Look at the weekly totals and you see 44, 46, 58, 37. Still noisy, but readable. The wobble on a weekly count of 50 is about 14%.
That's what Meta's 50 means. It's roughly the point where a week's worth of results has a small enough wobble that a genuinely better ad can stand out from a lucky one. It's the amount of evidence the assistant needs before it's willing to commit.
Now consider what happens when you split that same budget across five ad sets. Each one gets about 10 conversions a week. The wobble on 10 is about 32%. You haven't given Meta five things to learn from. You've given it five assistants, none of whom will ever see enough receipts to make a confident call.
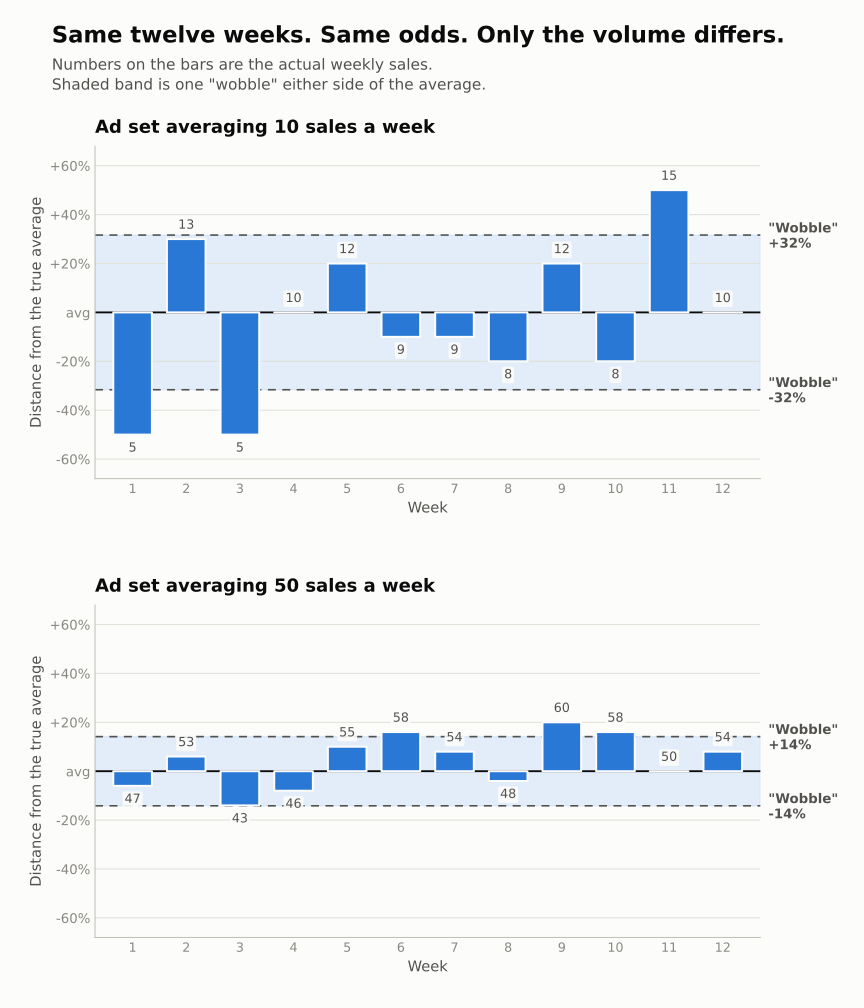
Same twelve weeks, same odds. Notice that in both charts about one week in three lands outside the shaded band. That's expected, since one wobble covers about two weeks in three no matter the volume. The difference isn't how often you land outside the band. It's how far outside "outside" is. Suppose one ad gives a 20% lift over another. With a 14% wobble, that lift stands out and is easy to see. With a 32% wobble, a 20% lift is smaller than the normal week-to-week swing, so it gets hidden in the noise. Only one of those ad sets can tell a better ad from a lucky one.
What to do about it
If you have the budget for 50 conversions a week and you've spread it across several ad sets, consolidate. One campaign, one ad set, until you're well past 50. Add a second only when you have a specific problem the second one solves and the volume to support both.
If you don't have the budget for 50 a week at all, that's a different situation. Keep running if the results are worth it. Just know that every daily number you're looking at is mostly noise, and resist the urge to act on it.
About Meta's 28%
Meta says ad sets under the threshold ran about 28% more expensive per purchase "in our analysis." They don't say what analysis. No sample size, no time period, no mention of whether they accounted for the fact that ad sets under 50 a week usually have smaller budgets, which can be more expensive for reasons that have nothing to do with learning.
So I wouldn't quote the 28% as gospel. But the direction is right, and the math above is why. You don't have to trust Meta's number. You just have to understand that an assistant working from 7 receipts a day can't do better than guess, and you're paying for the guess.
One last thing. The store example assumes every day is the same. Real businesses have slow Mondays, payday weekends, weather, competitor sales. All of that adds noise on top of what's shown here. The charts are the best case. Real accounts are messier.