A note before we begin. This article is not actionable. It will not improve your ROAS or help you build better creatives. We wrote it because the history is genuinely strange and we thought you might enjoy it. Feel free to skip it.
Some days, running ads feels like getting kicked by a horse.
Every Ad Impression Is a Long Shot
Consider what actually has to happen for a Meta ad impression to become a sale. A person has to see the ad. They have to click it. Then they have to buy something. A click-through rate of 2% is respectable. A landing page conversion rate of 5% is quite good. Multiply those together and the probability of any single impression resulting in a purchase is 0.1% — roughly 1 in 1,000.
That is a rare event.
Over a hundred years ago, a Prussian mathematician was studying a different rare event: the probability of soldiers in the Prussian cavalry being killed by accidental horse kicks. The average rate was less than one death per cavalry unit per year. The events were unpredictable at the individual level, clustered oddly in the data, and looked to most observers like pure chance. He suspected otherwise.
What he found — and what still applies to your ad account today — is that rare events are not as random as they look. They have a shape. And once you know the shape, the chaos becomes a lot less alarming.
The core idea, before we get to the history.
When rare events happen independently at a stable average rate — conversions, server errors, horse-kick fatalities — they don't space themselves out evenly. They cluster. Some periods have more than you'd expect; some have fewer. That clustering isn't randomness. It has a predictable shape. The formula that describes that shape is called the Poisson Distribution — named, eventually, after the Frenchman who invented it and then promptly moved on.
The Formula That Nobody Noticed
In 1837, a French mathematician named Siméon Denis Poisson published a formula for modeling rare events occurring at a stable average rate. Nobody paid much attention. Poisson moved on and died three years later.
The formula sat there for sixty years.
Poisson on work-life balance. Poisson is reported to have said that "life is good for only two things: doing mathematics and teaching it." He reportedly worked on mathematics on his wedding day. He held positions at three institutions simultaneously. Editor's note: We are not endorsing this as a lifestyle choice.
Enter the Prussian. And the Horse.
In 1898, a Prussian mathematician named Ladislaus Bortkiewicz was testing Poisson's forgotten formula — trying to find real-world data that fit its conditions. He published his findings in a slim book called Das Gesetz der kleinen Zahlen — The Law of Small Numbers. Twenty-three pages. It would become one of the most cited demonstrations in the history of statistics, and the reason was a table near the end.
Bortkiewicz had obtained twenty years of records from fourteen Prussian cavalry units, documenting soldiers killed by accidental horse kicks. This was not a morbid hobby. He was looking for data that met the conditions Poisson's formula required: rare events, occurring independently, at a stable average rate. Cavalry horses — large, frequently startled, and professionally indifferent to the rank of the person behind them — provided 280 unit-years of clean data and 196 deaths.
The average worked out to 0.7 deaths per cavalry unit per year. Bortkiewicz ran the formula. Then he compared the predictions to the actual records.
| Deaths per Year | % of Cavalry Units Observed | % of Cavalry Units Predicted |
|---|---|---|
| 0 | 51.4% | 49.6% |
| 1 | 32.5% | 34.8% |
| 2 | 11.4% | 12.2% |
| 3 | 3.9% | 2.8% |
| 4+ | 0.7% | 0.6% |
Bortkiewicz (1898). Prussian cavalry units, 1875–1894. 280 unit-years, 196 total deaths, λ = 0.7.
Show me the math. The Poisson formula calculates the probability of exactly k events occurring in a given period, when the average rate is λ (lambda):
P(k) = e⁻λ × λᵏ / k!
Where λ is the average number of events per period (0.7 deaths per cavalry unit per year), and k is the number of events you want to predict the probability of (0, 1, 2, 3...). The "!" is a factorial — 3! = 3 × 2 × 1 = 6. The "e" is Euler's number, approximately 2.718.
If you're not into math, no worries — this won't be on the test.
The fit was close enough to be startling. Not approximately right — uncomfortably right. The formula, applied to nothing more than the average rate, predicted the shape of the data across every category.
The Part That Shocked People
In 1898, accidental deaths were considered acts of God — unpredictable by definition. The idea that you could take last year's accident rate, plug it into a formula, and accurately predict this year's outcomes — with no knowledge of the specific horses, the specific soldiers, the specific circumstances — was not just surprising. It was philosophically disturbing.
The theological implication nobody wanted to discuss. If accidental deaths by horse kick follow a predictable mathematical law, are they really "accidents"? Are they really acts of God? Bortkiewicz did not address this question in his twenty-three pages. Wisely, perhaps.
He did note, with characteristic understatement, that the agreement between predicted and observed values was "remarkably close."
What the Formula Predicted
The shape of the formula — for the cavalry data, with an average of 0.7 deaths per cavalry unit per year — looks like this. Most periods have zero events. A meaningful fraction have one. A small number have two or three. The tail drops off quickly. And the entire shape is determined by that single average rate.
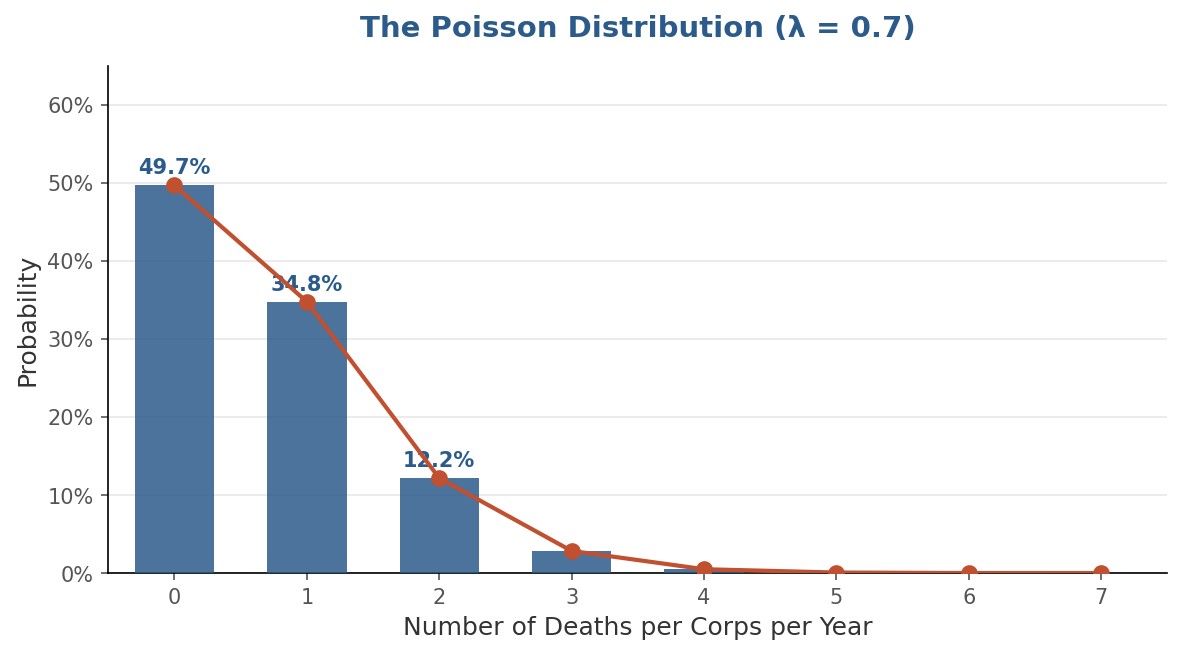
The Poisson distribution with λ = 0.7. The single parameter λ (lambda) — the average event rate — determines the entire shape.
This is what makes the formula useful. You don't need a complicated model. You don't need to understand the mechanism behind any individual event. You need one number: the average rate. Everything else follows.
Advertising conversion data, particularly for lower-frequency events like high-value purchases, often follows a similar shape — not because the math was designed for it, but because the underlying conditions tend to hold. Events are roughly independent. The average rate is relatively stable. Any individual conversion is rare relative to the total number of impressions. When those conditions are met, the distribution fits. When they don't — when something genuinely changed, when a campaign shift altered the underlying rate — the fit breaks down. That breakdown is itself informative.
The honest caveat. The formula assumes events are independent and the average rate is stable. Ad performance data frequently violates both — campaigns are actively managed, budgets shift, audiences saturate. The distribution is a starting point, not a complete model. Its real value is telling you what "normal randomness" looks like, so you can recognize when something genuinely abnormal is happening.
What Horse Kicks Can Teach You About Your Worst Weeks
The formula carries Poisson's name, but it's Bortkiewicz's horse-kick data that made it famous — and his twenty-three pages are still assigned in graduate statistics courses today. What he demonstrated in 1898 is as relevant to your ad account as it was to the Prussian cavalry: purchases don't arrive in a steady, predictable stream. They clump. They go quiet for stretches. Then several show up at once. That's not your ads breaking down or suddenly finding their stride — that's just what rare events look like in the wild. The job of a good advertiser isn't to react to every ripple. It's to know the difference between a ripple and an actual wave.